
No products in the cart.

Tested on Android O, P

Tested on iPhoneX / iOS12
Have a doubt? Check out our Support section


")
")
")
")
")
")
")
")
")
")
")
")
")
")
")
")
")
")
$35.00 – $70.00
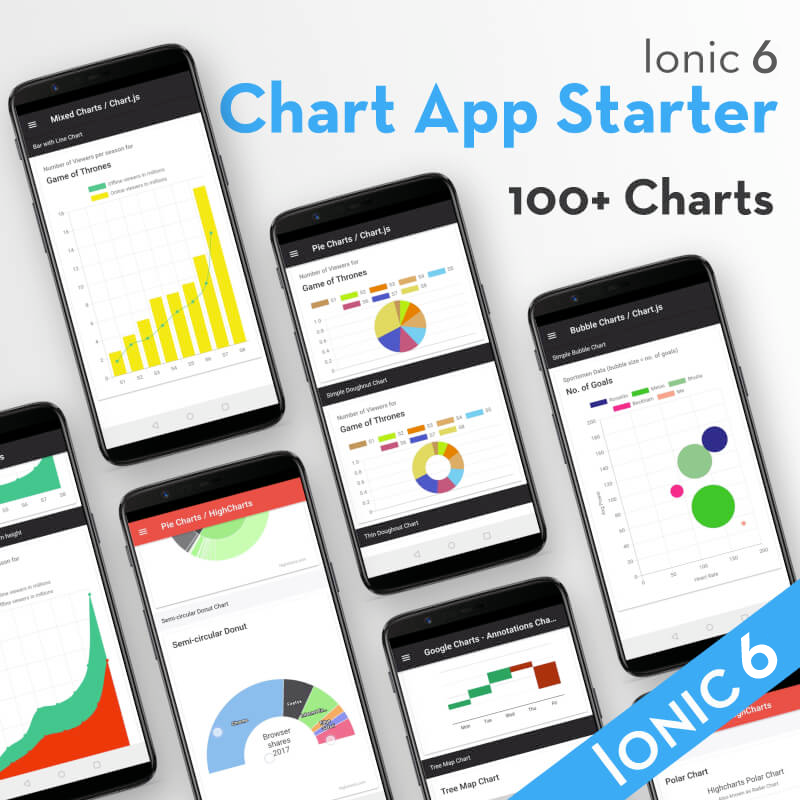
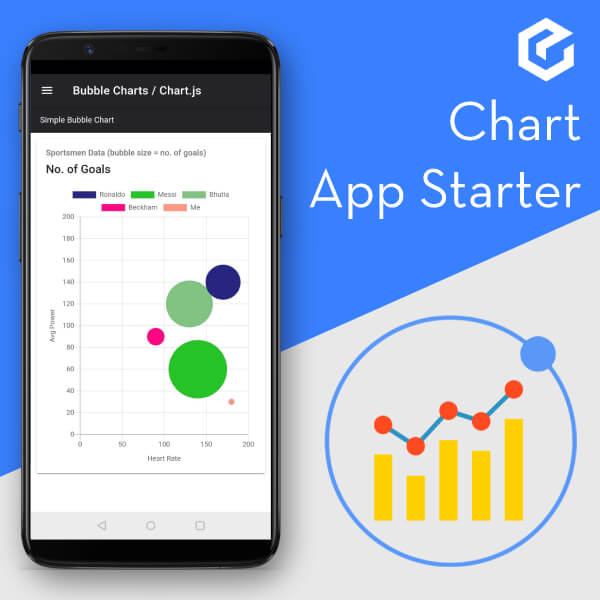
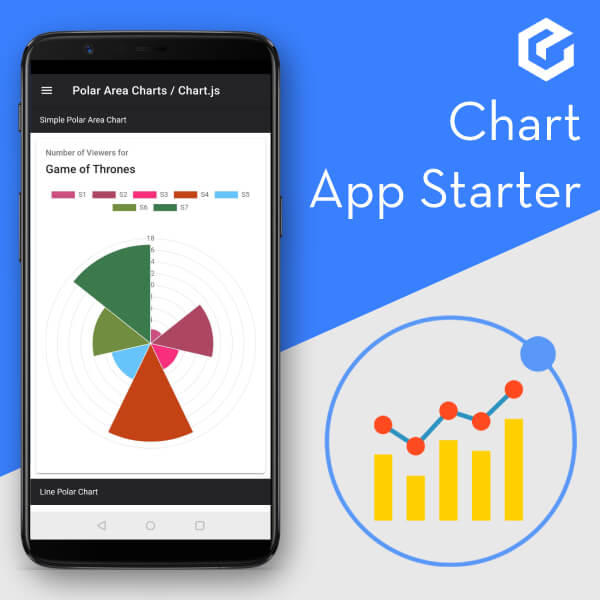
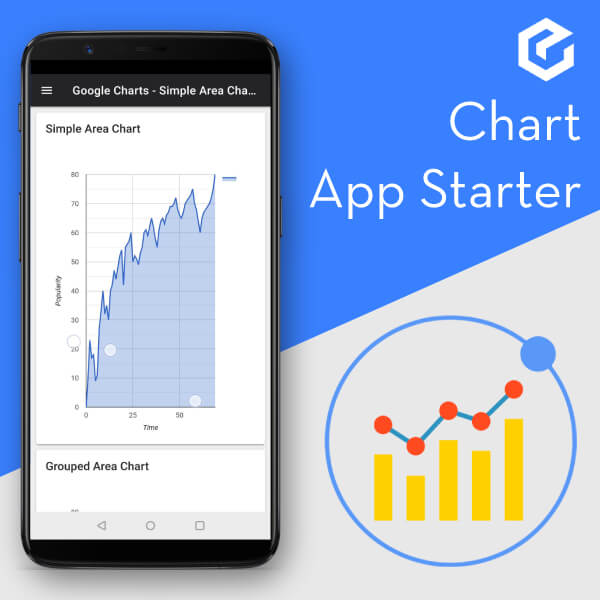
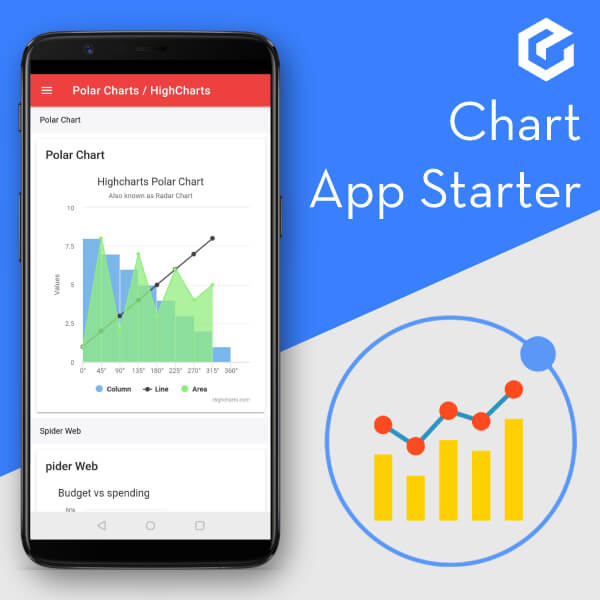
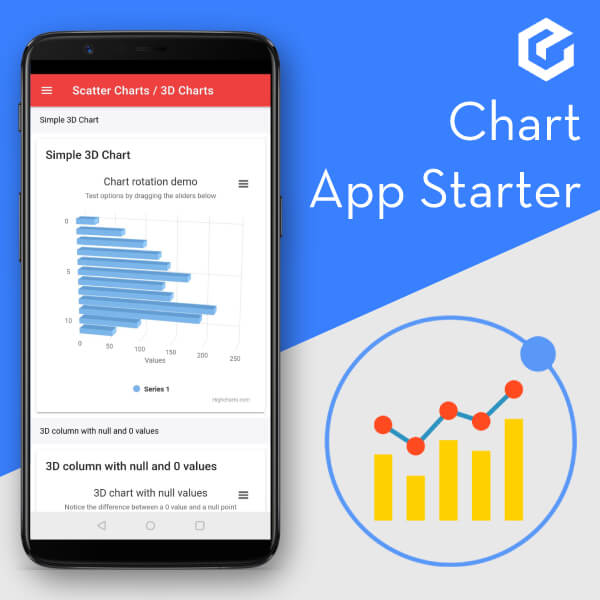
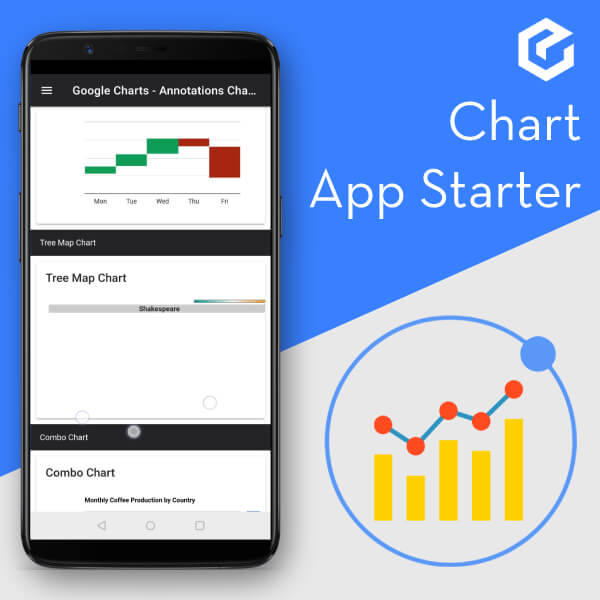
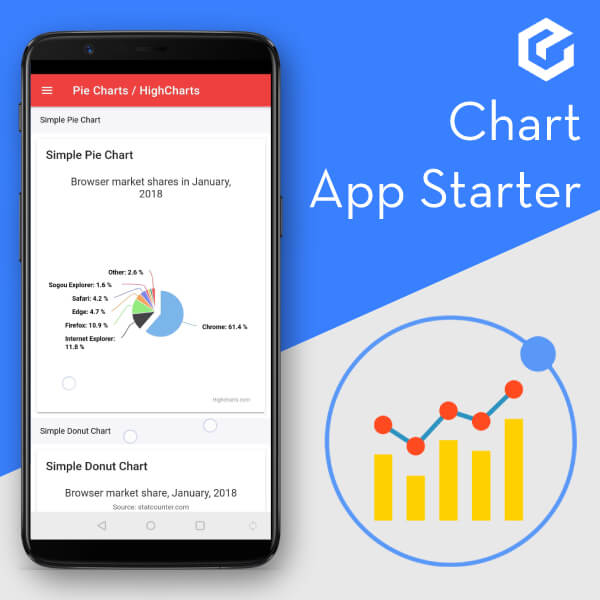
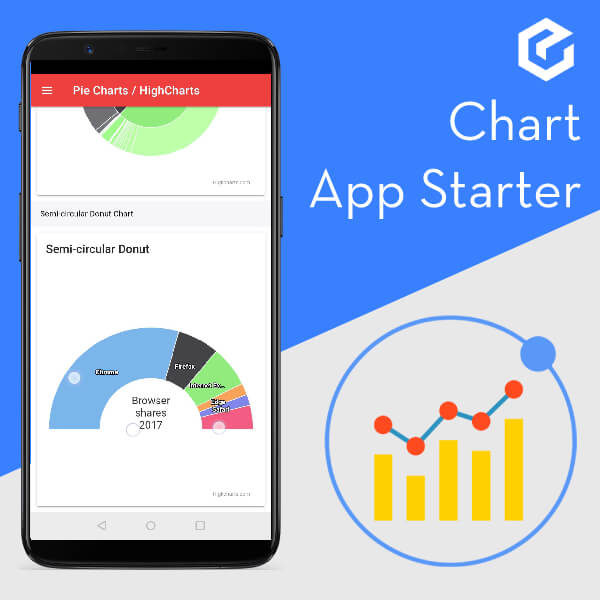
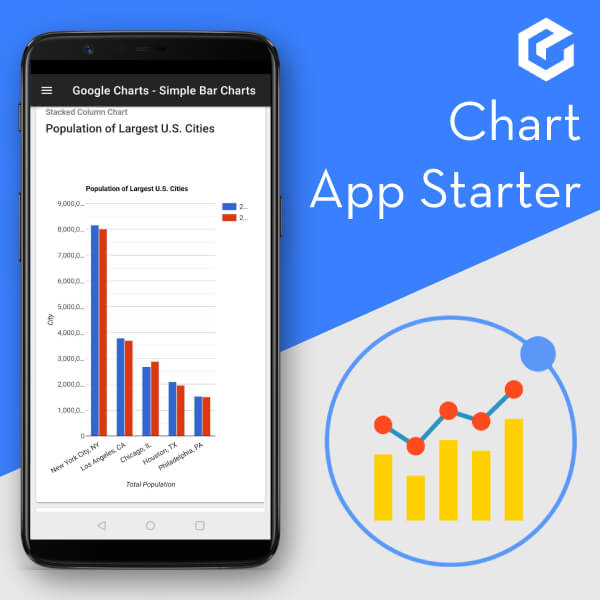
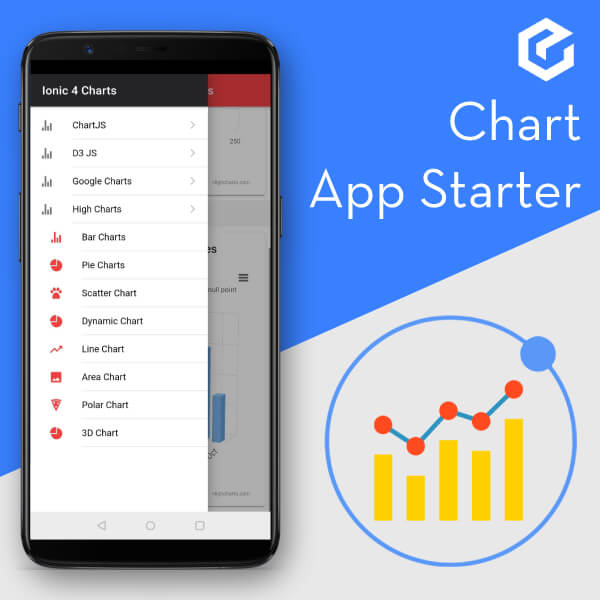
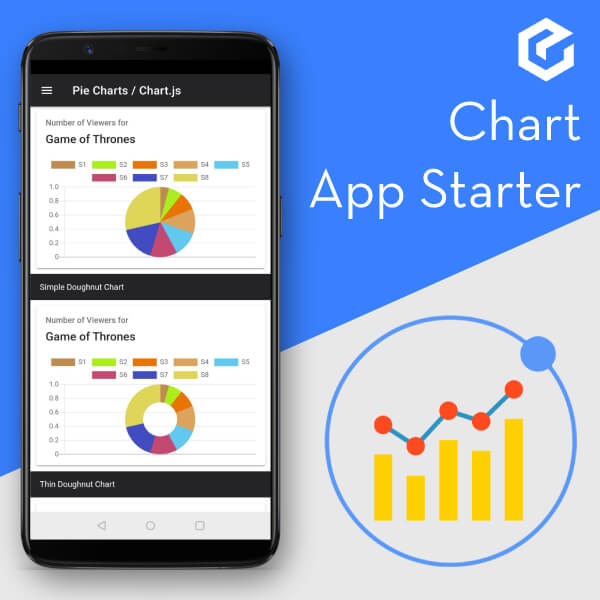
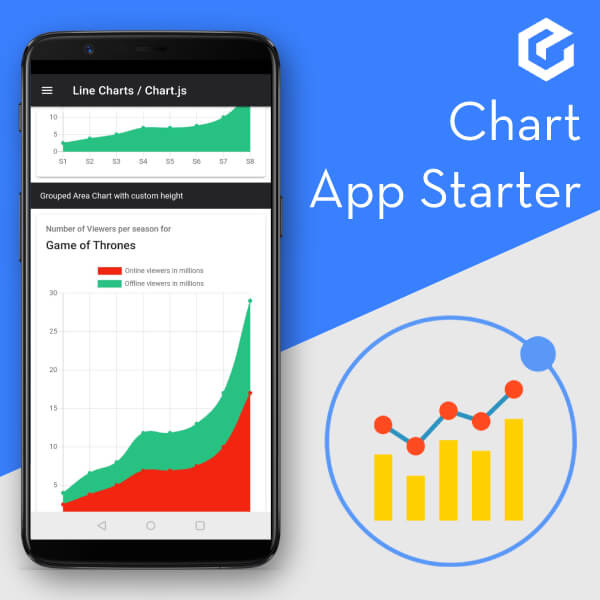
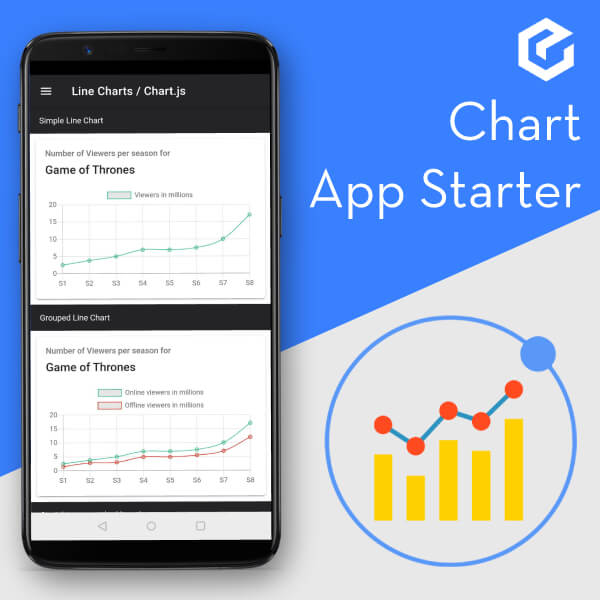
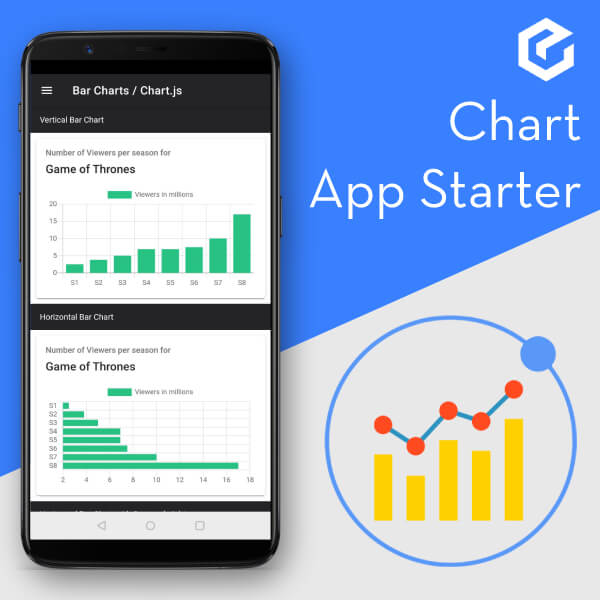
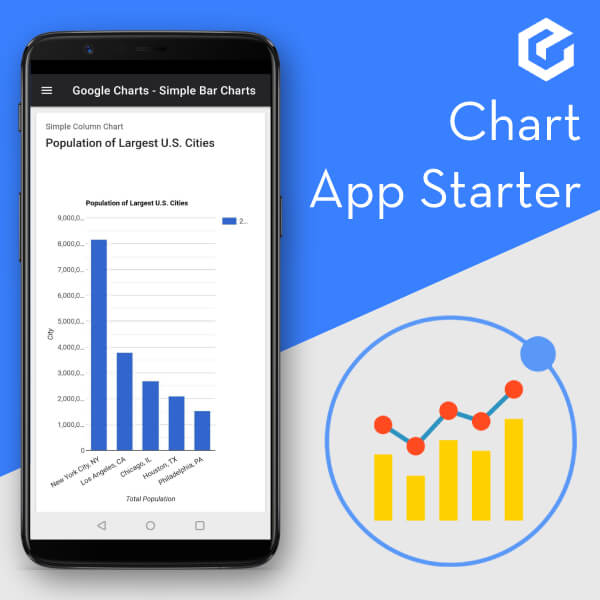
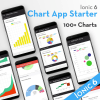
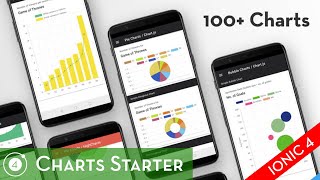
Get the amazing UI and source code of Chart app for your Ionic 4 project. Start your own chart based app!

5-Star customer satisfactions


 No required coding skill for everyone
 Reuseable Moduler & Easy to Customize
 Frequent Updates & release version
 Awesome Support sharing and caring
| License | Basic License, Extended License |
|---|
| Starter Type | FRONT END Read More |
| Technology | Ionic 6 |
| Node | 16.x |
| NPM | 7.x |
| Ionic CLI | 6.16.3 |
| Angular CLI | 13.0.4 |
| Ionic | 6.0.1 |
| Chart.js | 3.6.2 |
| High charts | 9.3.2 |
| ng2-google-charts | 7.0.0 |
| Tested on | Android 10 iOS 12 |
| Product Contents | Source code Zip File, License Certificate |